Portfolios keep getting bigger
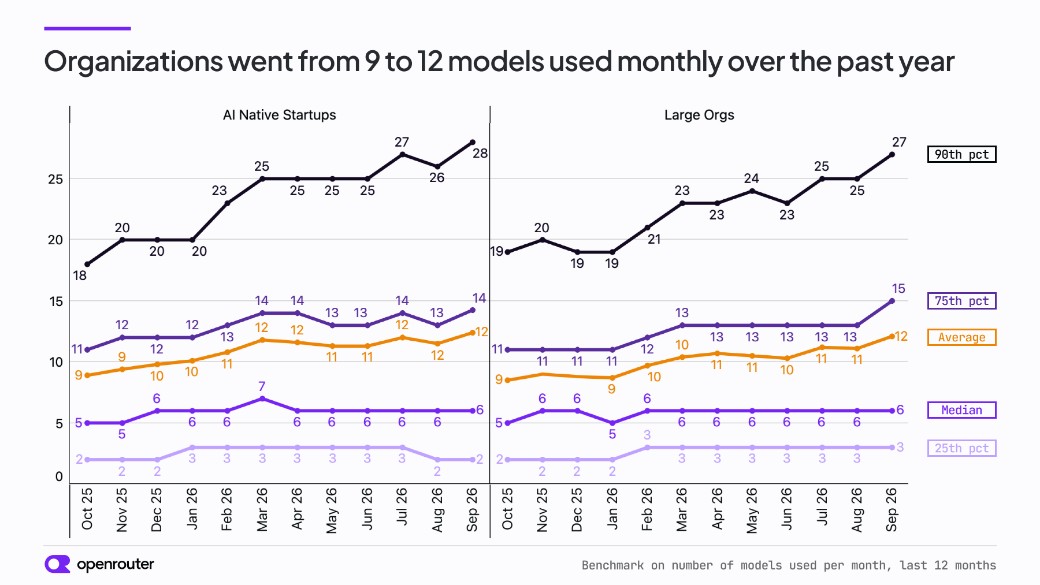
Over the past year, the average AI native startup went from 9 models a month to 12, and so did the average large org, though the median stayed put around 6.
However just like startup fundraising, there is a power law in model users. The 90th percentile for AI native startups went from 18 to 28 models. The 75th percentile went from 11 to 14.
A typical org runs a handful of models and adding a new one to the portfolio is a big decision. A large minority runs dozens, sending different workloads to different models and trying most new launches as they arrive.
One model still does most of the work
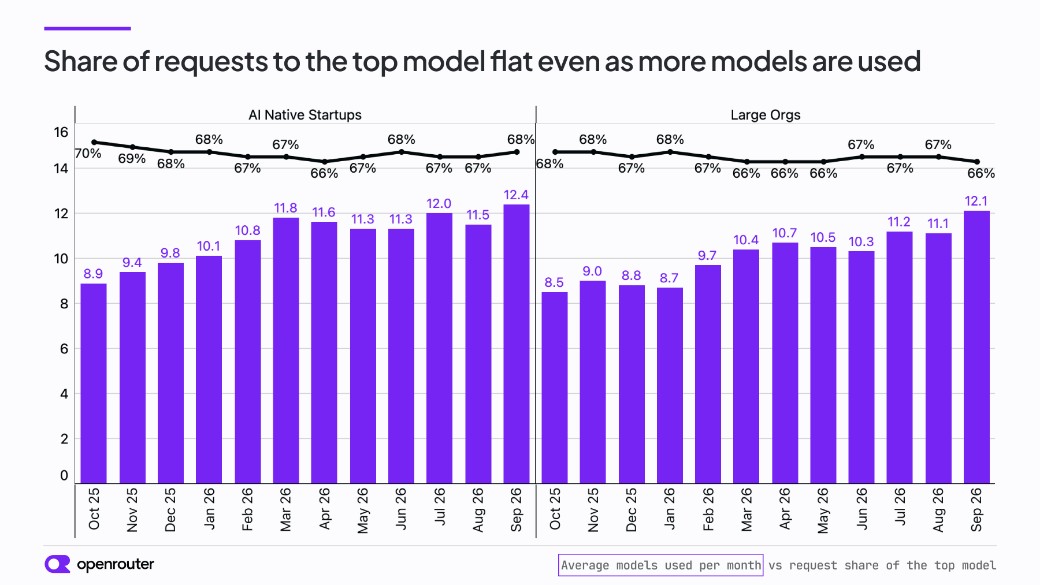
More models doesn’t guarantee traffic gets spread more evenly. In September, the average AI native startup sent 68% of its requests to its top model, and the average large org sent 66%.
So while the average portfolio grew by about 40%, the main model lost only 2 points of share. That suggests a hub-and-spoke setup. One model acts as the “daily driver”, carrying two-thirds of the request load. The other ten or so models split the remaining third: evaluations, specialized tasks, fallbacks, and new launches being tested. New models get added at the edges much faster than they replace the hub.
Switching the main model is routine
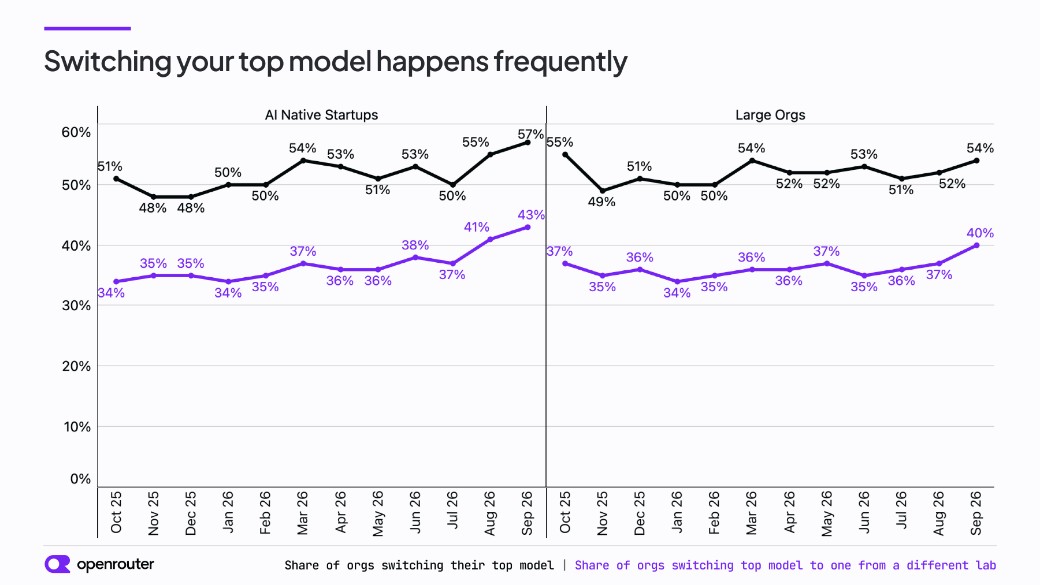
In every month of the past year, between 48% and 57% of these orgs had a different top model than the month before. So for roughly half of them, the main model changes in any given month.
The increasing pace of model releases serves as the background context to this seemingly major choice. Waiting 2 or 3 months to give a new model a try as your daily driver may mean you are more than one generation behind the frontier.
The bigger shift is where orgs switch to. Last October, about two-thirds of switches went to a model from a different lab (34% of AI natives and 37% of large orgs). By September it was about three-quarters (43% and 40%). Both lines rose mostly over the last two months. In Issue 02 we found that new models take share quickly, and this analysis shows the same is true from the buyer’s side: loyalty to a single model is weak, and loyalty to a single lab is getting weaker.
Certain workloads move to new models slowly
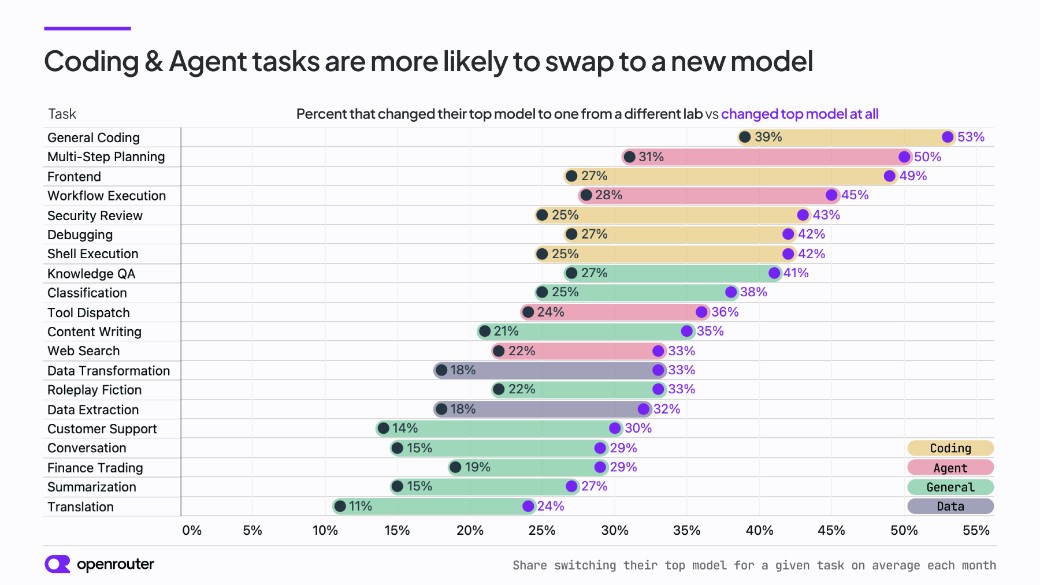
How often the main model changes depends a lot on what it’s used for. For each account and each task, we checked whether the top model for that task changed from one month to the next.
Coding and agent work churn the most. 53% of accounts changed their top model for general coding, 50% for multi-step planning, 49% for frontend work, and 45% for agent workflow execution. Coding is also where cross-lab moves are most common: 39% of accounts moved general coding to a different lab’s model.
Language and support tasks are the stickiest. Translation changed top model 24% of the time, summarization 27%, and conversation and customer support 29 to 30%. Only 11 to 15% of accounts moved those tasks to a different lab.
Sticky tasks are also more concentrated. For translation and summarization, the top model handles 81 to 83% of an account’s requests for that task. For general coding, it’s 64%.
One interpretation is that for translation, summarization and support, current models are already “good enough”, and switching means re-checking prompts and outputs that customers see for relatively little gain. For coding and agents, each new launch can noticeably change results so teams keep testing and moving.
Your model portfolio
Organizations are compiling model portfolios but each portfolio has a center of gravity. The typical org keeps about two-thirds of its traffic on one model, adds new models around the edges, and is not shy about replacing that center when a new flagship model arrives.
See which models are winning each task right now on /rankings.
Onwards,
Peter
Charts 1 to 3 cover organization accounts in the AI-native and large-org segments, October 2025 to September 2026, by request count. Models used = distinct models with at least one request that month. Top model = the model with the most requests in a month. Switch = a different top model than in the previous month, among orgs active in both months; a different lab = a different model author. The task chart covers all account types and classified traffic only: account-task pairs with at least 10 requests in both months, June→July, July→August and August→September 2026 pooled, for tasks with at least 50 pairs.